


Table of contents
Introduction
In the Java world, there are only two logging frameworks worth mentioning. And their battle for dominance is as legendary as the tale of the language itself.
Log4j was introduced in the early 2000s. It is a well-tested (welp !) and battle-hardened framework that is used by most Java enterprises. In fact, until recently, Log4j had a near-monopoly on the Java logging market share. In fact the only reason I moved over to logback as a primary logger is because the security aspect of log4j is seriously messed up to the point where the host application gets compromised due to bugs in log4j.
Logback came along as a successor to Log4j. It is faster, more reliable, simpler, and more extensible (we are going to exploit this aspect of Logback in this article). In their website, Logback boasts that their logging framework is the most unit-tested codebase. Hence, it is considered highly secure and since has been very popular among Java developers.
Our use case
Most modern server side components written with Java are micro services. A modern microservice, basically connects with a bunch of external services and handle a bunch of upstream data and pushes onto other downstream components for ingesting, or data lakes to store.
For the simplicity's sake, I will not be talking about actual production components here. Instead lets take a simple example. In stock markets, each exchange like NSDQ, NYSE etc. have their own exchange servers. Those servers are the original producers of data. We will even simplify and consider only a single company. Let's take one minute data from Google (ticker symbol GOOGL). That's around 1000 records of data per day.
Suppose we have an analyser that is connected to the exchange server cluster of NSDQ. Once the data arrives, it first saves the data in a Kafka topic. Then it calculates 5-minute, 15-minute, 30-minute and 60-minute data from that 1-minute data (just simple mathematics).
Once every hour, i.e., once the 60-minute record for GOOGL is calculated, the component then saves entire dataset into different DB tables at once as a single batch for safe keeping. Then it informs another Apache Spark based component to process the data on the topics (just a message).
Following image summarizes the scenario:
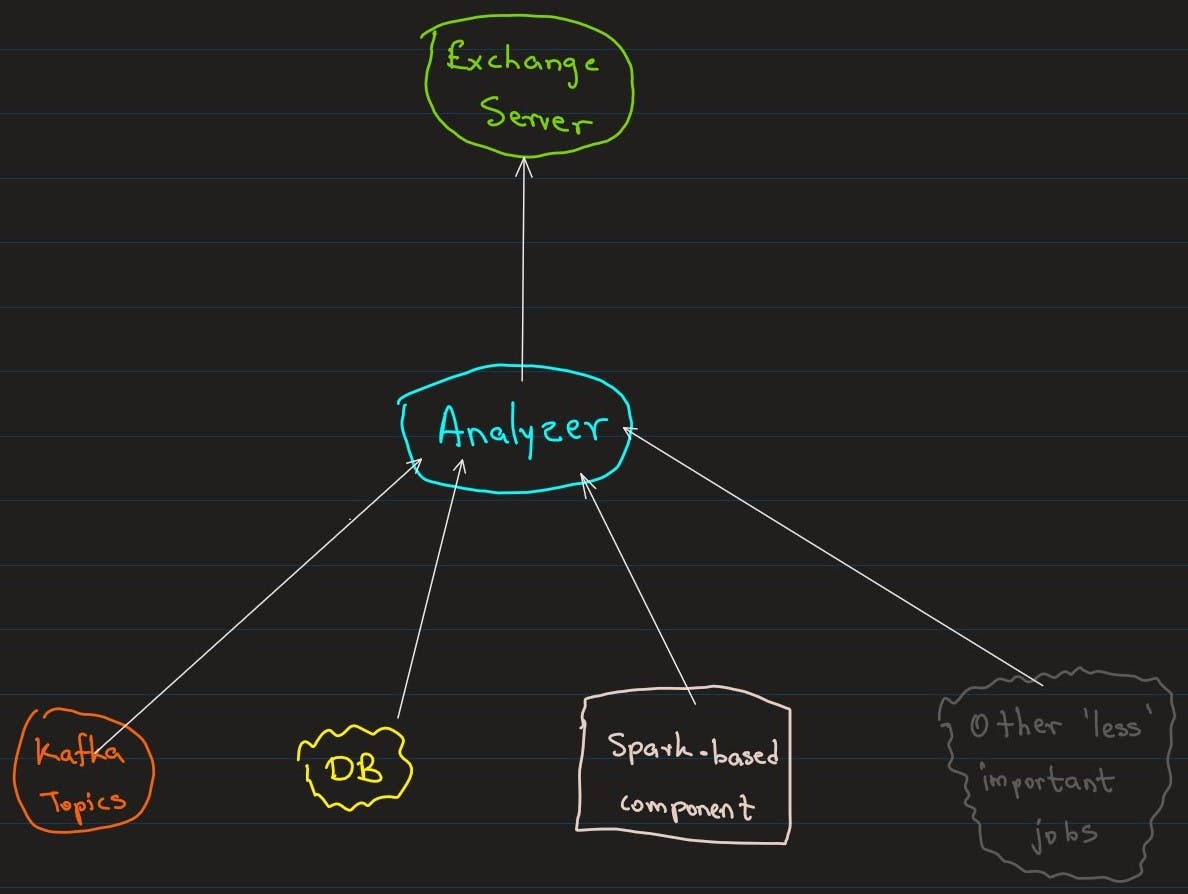
Now you can see although the above component does simple work, it does need to log 5 different things.
Log its work itself (app.log)
Log summary statistics for the data it just generated for 5, 15, 30 and 60-minute data (summary.log)
Log the interaction between component and Kafka channels (kafka.log)
Log the interaction between component and the other spark based component (out.log)
Log the DB calls (db.log)
Log anything else (suppose the component supports user query, or if it is distributed then it may send heart beat messages. These are messages of lower status and can be logged together - other.log)
An actual enterprise feed analyser may have several other logging requirements. For example, it may out source the calculation part to another component. It may need master ticker data from DB before processing. It may connect to in-memory grids for caching like redis or infinispan etc. The example I put above is just a simplified version of it.
A not so good way...
The problem to tackle here is that the component may have several classes that do different analysis. Each class would want to log on all the above 6 loggers. The usual approach where we add a logger per class like this:
public class Main {
    private static final Logger log = LoggerFactory.getLogger(Main.class);
    public static void main(String[] args) {
        log.info("<DB> call to database");
        log.info("<Kafka> call to kafka");
        log.info("<Kafka> call to 3rd party software");
    }
}
will not work. Because now all the different calls are executed by the same logger. We cannot control which log line goes to which file. So, how about we define different classes and assign them to the loggers. Like this:
public class Main {
    private static final Logger DB = LoggerFactory.getLogger("DB");
    private static final Logger KAFKA = LoggerFactory.getLogger("KAFKA");
    private static final Logger EXTERNAL = LoggerFactory.getLogger("EXTERNAL");

    public static void main(String[] args) {
        DB.info("<DB> call to database");
        KAFKA.info("<Kafka> call to kafka");
        EXTERNAL.info("<ThirdParty> call to 3rd party software");
    }
}
This could work:

You can see the different loggers in print. However, defining XML configuration for each logger is a tedious work. Imagine writing repeated logs for 20 something loggers. That would be error prone, and the last thing we want is invalid logging when a production issue comes up.
A better approach
Instead of that we are going to define our own heavily simplified configuration file. Let's see what we want.
We need to identify the specific logger. So we need a name.
We need to configure the file name for the logger that we want to write our data to.
We need to define what log level we are going to allow the logger.
We need a boolean switch to enable/disable the logger at the app start-up.
This is because when you want to reproduce the bug in a component, and you know specifically what area the bug is in, say Kafka channels are not connecting. Then you do not want the logger to clutter the file by writing other logs.
I'd suggest having these settings in a YAML file. Spring Boot, and Jackson natively supports .yml configurations. Ultimately following would be our log-settings.yml.
app:
  file: 'app'
  level: TRACE
  enabled: true

in:
  file: 'in'
  level: DEBUG
  enabled: true

out:
  file: 'out'
  level: INFO
  enabled: true

db:
  file: 'db'
  level: WARN
  enabled: true

kafka:
  file: 'kafka'
  level: ERROR
  enabled: true

summary:
  file: 'summary'
  level: TRACE
  enabled: false
NOTE: From now on I'll only put necessary bits of code for brevity. The complete codebase is available in my GitHub repo.
Exploiting SiftingAppender
To transform our configuration to the actual logback.xml, we will be leveraging a specific appender called SiftingAppender.
SiftingAppender is a higher level abstraction over other normal appenders such as ConsoleAppender, FileAppender, RollingFileAppender, DBAppender etc. It lets us define different parameters during runtime, say which file to log, which format to use when logging etc.
Since we will be wanting file rollover, we can enclose RollingFileAppender with the SiftingAppender. We will enclose this entire setup again with AsyncAppender. This is because typically the log generation for analysers happens extremely fast as in every fraction of a millisecond there will be logs. Hence, slow down in log writing would result entire application slow down.
This is our final configuration for SiftingAppender.
<appender name="SIFT" class="SiftingAppender">
    <discriminator class="LoggerNameBasedDiscriminator"/>
    <sift>
        <appender name="ROLLIN" class="RollingFileAppender">
            <file>${LOG_PATH}/${fileName}-${startTimestamp}.log</file>
            <encoder class="PatternLayoutEncoder">
                <pattern>${LOG_FMT}</pattern>
            </encoder>
            <filter class="LoggerNameBasedFilter"/>
            <rollingPolicy class="SizeAndTimeBasedRollingPolicy">
                <fileNamePattern>${LOG_PATH}/archived/%d{yyyy-MM-dd}/${fileName}-${startTimestamp}-%d{yyyy-MM-dd}-%i.log</fileNamePattern>
                <maxFileSize>250MB</maxFileSize>
                <maxHistory>50</maxHistory>
            </rollingPolicy>
        </appender>
    </sift>
</appender>

<appender name="ASYNC" class="AsyncAppender">
    <appender-ref ref="SIFT"/>
    <queueSize>10000</queueSize>
    <includeCallerData>true</includeCallerData>
</appender>
Note the three words in the above configuration. fileName, LoggerNameBasedDiscriminator, and LoggerNameBasedFilter. We will be exploring them below.
Dynamically pass variables during runtime
How do we pass the variable? We do so by overriding Discriminator class in logback. Discriminator is a component that can be used to select a specific Appender based on the value of a property. We will use this class to give file name at runtime for each logger separately.
public class LoggerNameBasedDiscriminator implements Discriminator<ILoggingEvent> {
    // this should match the name mentioned in sifting appenderc
    private static final String KEY = "fileName";

    @Override
    public String getKey() {
        return KEY;
    }

    @Override
    public String getDiscriminatingValue(ILoggingEvent event) {
        LogManager logger = LogManager.get(event.getLoggerName());
        if (null != logger) {
            String fileName = logger.getFile();
            return null != fileName ? fileName : "other";
        } else {
            return "other";
        }
    }
}
Note the usage of fileName as KEY. This is the variable name that the SiftingAppender will keep track of when each log event is emitted.
Customised Filtering
What about filtering? We are going to have different filters for different loggers right? For this we can use the Filter class in logback. We will have to override the #decide method which will decide for each logging event, whether to approve or deny logging it.
public class LoggerNameBasedFilter extends Filter<ILoggingEvent> {
    @Override
    public FilterReply decide(ILoggingEvent event) {
        // this is for events which are originated from our LogManager
        LogManager logger = LogManager.get(event.getLoggerName());
        if (null != logger) {
            boolean isLevelSatisfied = event.getLevel().isGreaterOrEqual(Level.toLevel(logger.getLevel().name()));
            if (logger.isEnabled()) return isLevelSatisfied ? FilterReply.ACCEPT : FilterReply.DENY;
            else return FilterReply.DENY;
        } else {
            return FilterReply.ACCEPT;
        }
    }
}
Bringing it all together
Its time to put together all of these. We will define an enum with all loggers necessary.
@Getter
public enum LogManager {
    APP("app"),
    IN("in"),
    OUT("out"),
    DB("db"),
    KAFKA("kafka"),
    SUMMARY("summary");

    private Logger logger;
    private String file;
    private Level level;
    private boolean enabled;

    LogManager(String name) {
        this.file = logConfig.get("file").asText();
        this.enabled = logConfig.get("enabled").asBoolean();
        this.level = mapper.treeToValue(logConfig.get("level"), Level.class);
        this.logger = LoggerFactory.getLogger("tutorial.learn.code_snippets" + "." + name);
    }
}
The reason why I added the entire parent package name before logger name, is that say we use just the word "app" instead of "tutorial.learn.code_snippets.app", then logger discriminator may confuse actual "app" and "app" in say "SpringBootApplication" when these two names are provided as logger names. You could do an exact match, but I figured this is a safe approach.
Make sure to have your root level logger to be in TRACE level. If this is set it to say INFO, then even if you specify DEBUG in log-settings.yml, logback will not print.
<root level="TRACE">
    <appender-ref ref="STDOUT"/>
    <appender-ref ref="ASYNC"/>
    <appender-ref ref="ROLLING_ERROR"/>
</root>
So, how do we load the config ??
We will leverage jackson to do the yml parsing for us.
LogManager(String name) {
    try {
        ObjectMapper mapper = YAMLMapper.builder().build();
        JsonNode logConfig = mapper
                .readTree(Files.newBufferedReader(path, StandardCharsets.UTF_8))
                .get(name);
    } catch (IOException ioException) {
        System.out.println(Throwables.getStackTraceAsString(ioException));
        System.exit(1039);
    }
}
Note the usage of System.out.println when an exception occurs. Since this will load up at the start of our program, we will not have any capability of logging if we fail to load the config file. This is a critical error. So we print that to the screen and immediately shutdown.
Caveat 1 - What if this is a Spring Boot project?
Spring Boot uses its own way of initiating the loggers, unless we do it for them at the startup. What I mean is that we should not wait until spring boot starts up and loads all its beans, aka we should register our LogManager class as a component. Instead we should initiate this loading config section in a separate settings class and call that method before we even start spring boot.
In fact my current implementation also loads logs for every logger in the enum separately. That should not happen. We should put configuration loading in a separate class and shutdown if that fails.
@SpringBootApplication
public class AhrooAnalyzer {
    public static void main(String[] args) {
        Settings.loadSettings(Constants.CONFIG_PATH);
        SpringApplication.run(AhrooAnalyzer.class, args);
    }
}
Caveat 2 - Our logger is clumsy
With our current implementation a call to the app-logger would be like this:
public static void main(String[] args) {
    LogManager.APP.getLogger().trace("APP_TRACE");
    LogManager.APP.getLogger().debug("APP_DEBUG");
    LogManager.APP.getLogger().info("APP_INFO");
    LogManager.APP.getLogger().warn("APP_WARN");
    LogManager.APP.getLogger().error("APP_ERROR");
}
we could tackle this by using static imports. But what about #getLogger()?. What we could do is to enclose each method of Logger class in logback in LogManager class. That is a tedious job. We could again simplify that with @Deligate from lombok. So out logger would look something like this:
@Getter
public enum LogManager {
    @Delegate
    @Getter(AccessLevel.NONE)
    private Logger logger;
}
This brings us another problem. Note that here we are executing our code from Main class. However, logger prints the calling class, which is LogManager.
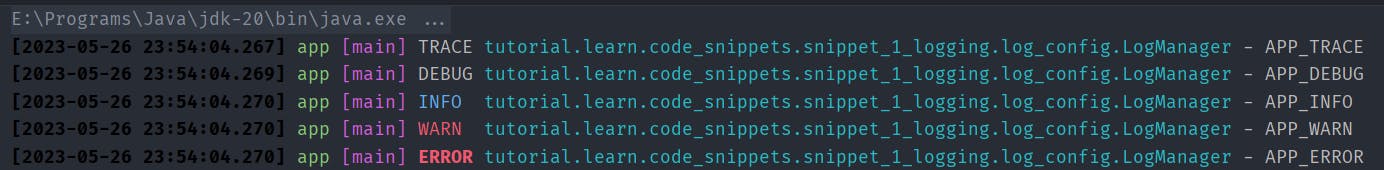
This is because since we delegate all our calls to LogManager, it is the one making the actual logger calls. Not the Main class. So, from the point of view of logback, LogManager is the executor class of those logs.
The culprit behind this is the %class in logging formatter.
<property name="LOG_FMT" value="%gray([%d{yyyy-MM-dd HH:mm:ss.SSS}]) %green(%logger{0}) %magenta([%thread]) %highlight(%-5level) %cyan(%class) - %msg%n%throwable"/>
To overcome this, we could override that variable to point to our actual caller class (which will be one step below the calling stack). In logback the class that handles %class related formatting is ClassOfCallerConverter.
public class DelegateAwareClassCallerConverter extends ClassOfCallerConverter {
    @Override
    protected String getFullyQualifiedName(ILoggingEvent event) {
        StackTraceElement[] cda = event.getCallerData();
        if (cda != null && cda.length > 1) {
            return cda[1].getClassName();
        } else {
            return super.getFullyQualifiedName(event);
        }
    }
}
We are checking the length of Stack Trace and get the owning class (aka one step below in stack trace) only if the length is greater than one (in this case length would be 2). We will pass it to super otherwise.
We need to then add a conversion rule (delegateAwareClass) to look for that class:
<conversionRule conversionWord="delegateAwareClass" converterClass="tutorial.learn.code_snippets.snippet_1_logging.log_config.DelegateAwareClassCallerConverter" />
and call that in our log formatter %cyan(%delegateAwareClass):
<property name="LOG_FMT" value="%gray([%d{yyyy-MM-dd HH:mm:ss.SSS}]) %green(%logger{0}) %magenta([%thread]) %highlight(%-5level) %cyan(%delegateAwareClass) - %msg%n%throwable"/>
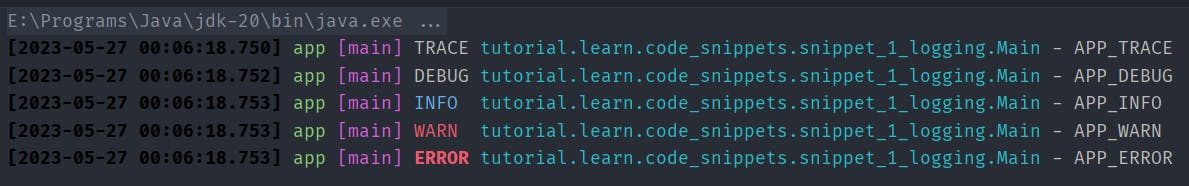
Now we can log like this:
public static void main(String[] args) {
    APP.trace("APP_TRACE");
    APP.debug("APP_DEBUG");
    APP.info("APP_INFO");
    APP.warn("APP_WARN");
    APP.error("APP_ERROR");
}